Guest post by researcher Anna Tucker
Linked paper: Effects of individual misidentification on estimates of survival in long-term mark–resight studies by A.M .Tucker, C.P. McGowan, R.A. Robinson, J.A. Clark, J.E. Lyons, A. DeRose-Wilson, R. Du Feu, G.E. Austin, P.W. Atkinson, and N.A. Clark, The Condor: Ornithological Applications 121:1, February 2019.
Color bands, leg flags, and other field-readable marks are a core component of the ornithologist’s toolkit. Mark-resight studies have led to invaluable insights into the demographics, movements, territoriality, and migration patterns of birds. But clear, confident IDs can be hard to obtain in the field. Colors are difficult to distinguish in low light or when worn, alphanumeric codes are easily mis-remembered or mis-recorded, and was it blue on the left, red on the right, or the other way around? The potential for misidentification is high, and that could have serious consequences for analysis and inference.
Mark-recapture models allow us to estimate demographic rates, but they assume that tags are not lost or misidentified, which is not always the case. Consider a bird that is captured in 2005 and marked with a leg flag with code A4T. This bird is resighted each year and dies in 2010. Now fast forward to 2015, when another bird, this one with flag 4AT, is seen but mistakenly recorded as A4T. Not only do we miss 4AT, but we have also mistakenly increased the apparent survival rate of A4T, and this could become a big problem if misread rates are high. In our recent paper published in The Condor, “Effects of individual misidentification on estimates of survival in long-term mark-resight studies,” we try to work out how frequently this happens and its effect on our ability to accurately estimate survival rate.
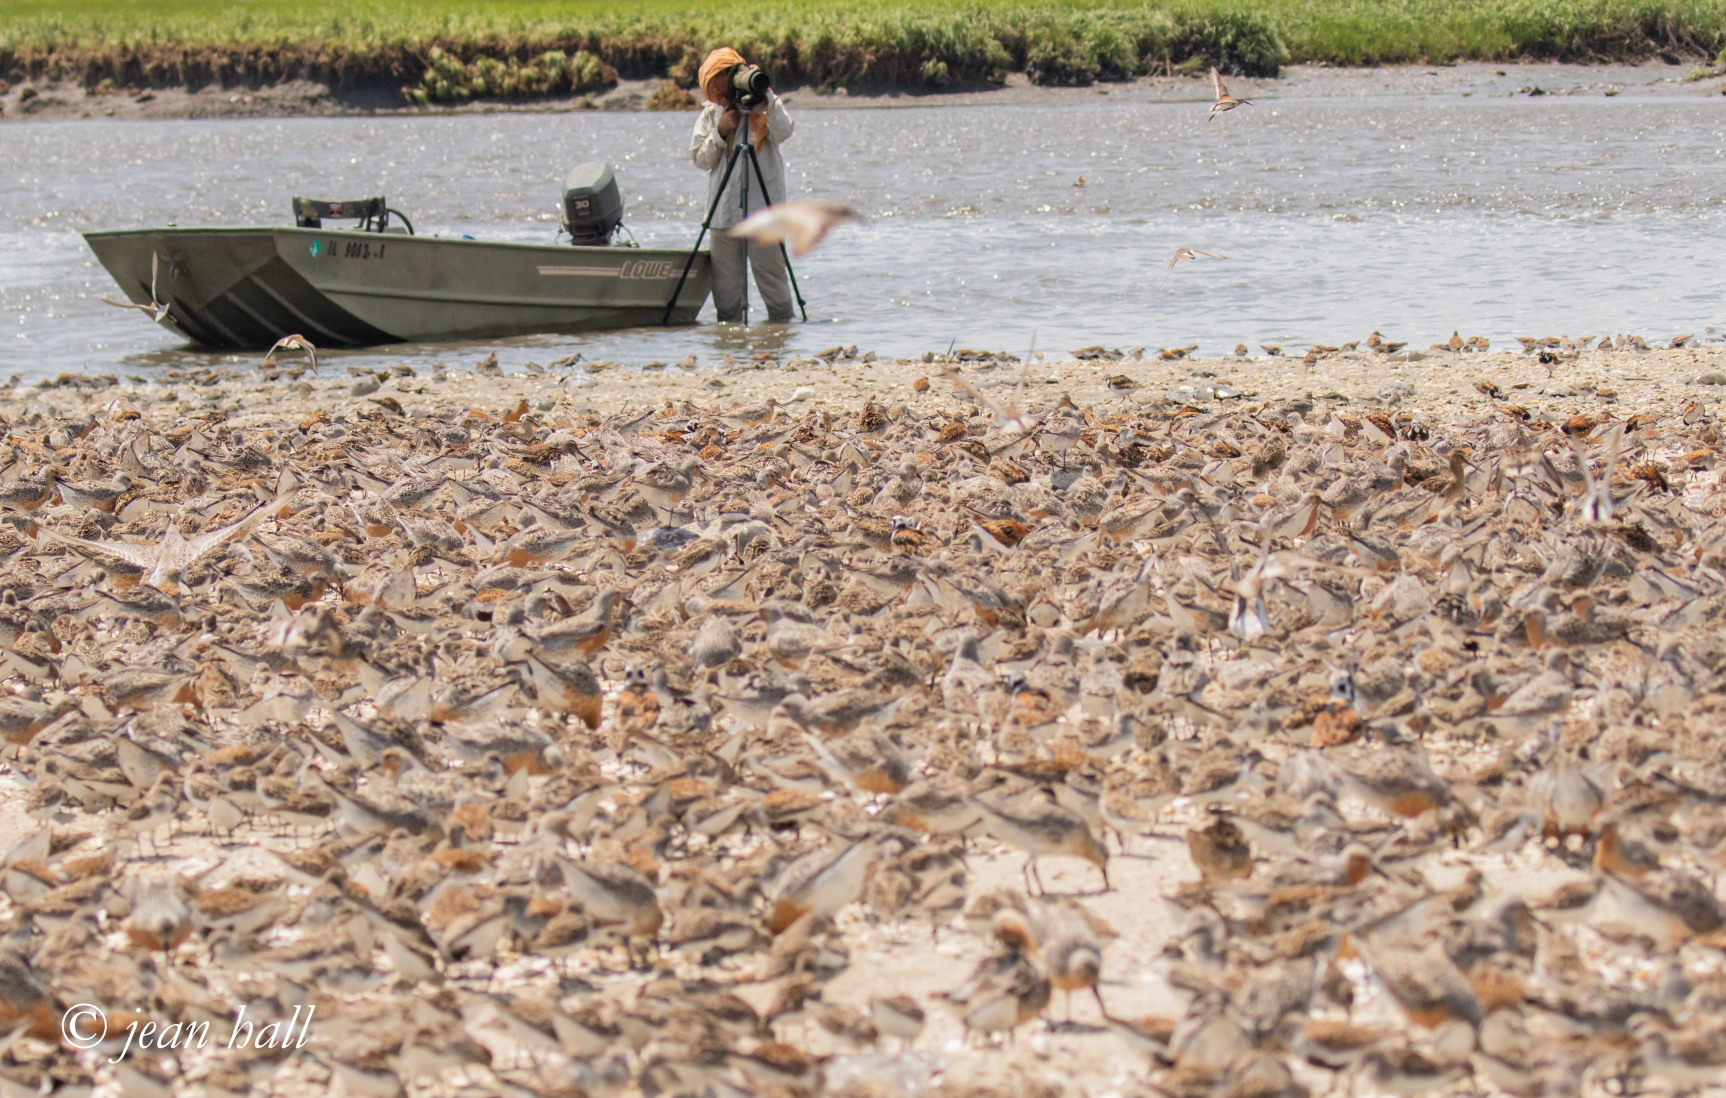
Delaware Bay is a globally important spring stopover site for Arctic-breeding shorebirds, a group of high conservation concern. Over the last 13 years, the Delaware Shorebird Project has marked Red Knots, Ruddy Turnstones, and Sanderlings passing through the area with individually identifiable leg flags. This work relies on volunteers who count, trap, and band birds and resight individuals each year. These volunteers have widely varying backgrounds and experience and spend differing lengths of time with the project, resulting in a lot of variation among observers’ level of training and experience with resighting birds.

The leg flags we use in Delaware Bay are commonly deployed on shorebirds around the world. For many years, my coauthor Dr. Nigel Clark has been concerned about the potential for misidentification and its consequences, but misread error rates are hard to quantify. So, in 2008 he randomly withheld 20% of the flags manufactured for that field season. This provided us with real possible codes that were never deployed and a way to directly estimate the minimum error rate in our dataset if erroneous resightings of those codes appeared in the data.
We also estimated a maximum possible error rate to get a sense of the range of possible error rates in our dataset. In Delaware Bay, individuals are often seen several times a year and by multiple different observers. Considering this, we identified records where a bird was only recorded once in a year as possible misreads, which we used to estimate maximum possible misread rate, since it seemed unlikely that the same misread error would occur more than once in a year.
Based on resighting data from 2009-2018, we estimated that the minimum misread error rate in our data was 0.31% and the maximum was 6.6%. We found that both average error rate and the variation among observers decreased with experience (the total number of flags an observer had resighted). Our study showed that failing to account for misreads can lead to an apparent negative trend in survival probability over time when none exists. In our paper, we also explore some ways to help mitigate the effects of misreads through data filtering.
Volunteer-based citizen science programs provide rich datasets that can help us understand the drivers of population dynamics and declines. However, when individual misidentification is possible, it’s important to understand error rates and filter potentially suspicious records to avoid biased inferences. Failing to do so could have serious implications not only for our understanding of population declines, but also for the conservation decisions we made based on those analyses.