By Eric Wood
Related paper: Historical racial redlining and contemporary patterns of income inequality negatively affect birds, their habitat, and people in Los Angeles, California by Eric M. Wood, Sevan Esaian, Christian Benitez, Philip J. Ethington, Travis Longcore, Lars Y. Pomara. Ornithological Applications
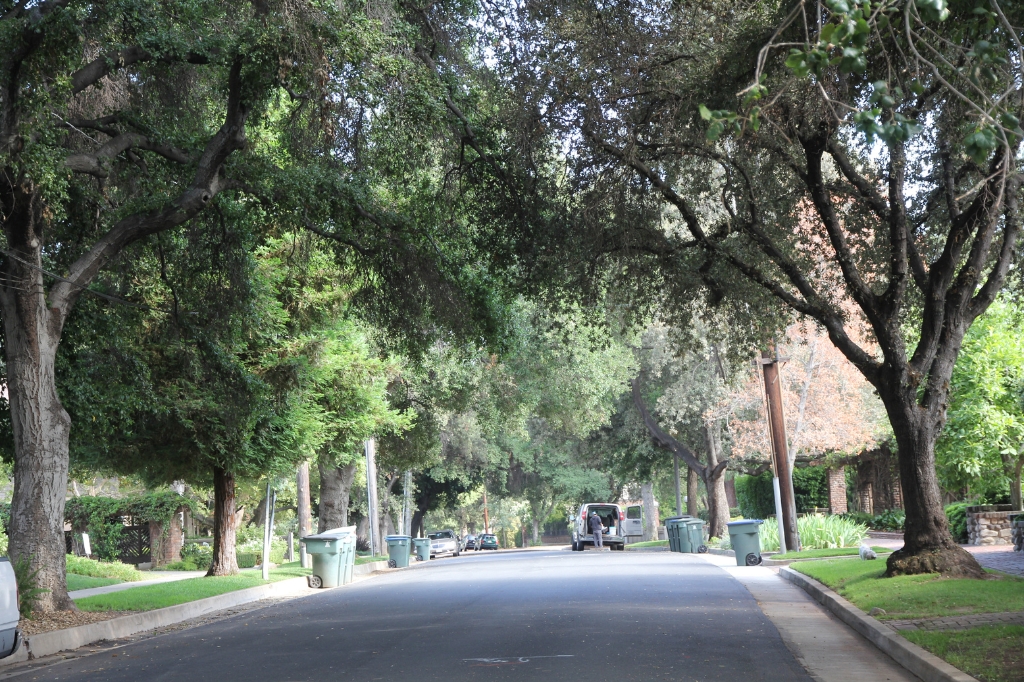
While driving around Greater Los Angeles (L.A.), one cannot help but notice that there are many trees in some, but not all, residential neighborhoods. The uneven distribution of trees in the city can be explained by the distribution of income throughout the area. Municipalities such as Beverly Hills and San Marino are dominated by a dense tree canopy, whereas South and East L.A. are not (Fig. 1). This pattern is explained by the ‘luxury effect,’ where there is a positive correlation between biodiversity and wealth (Leong et al. 2018). The luxury effect is a dominant theme in cities across the world, especially in arid zones (Chamberlain et al. 2020), and has been the baseline for numerous studies in my lab (Wood and Esaian 2020, Vasquez and Wood 2022, Smallwood and Wood 2023). However, a question we have often considered is, How did the luxury effect become so prominent in L.A.? To understand this, we need to go back to the history books.
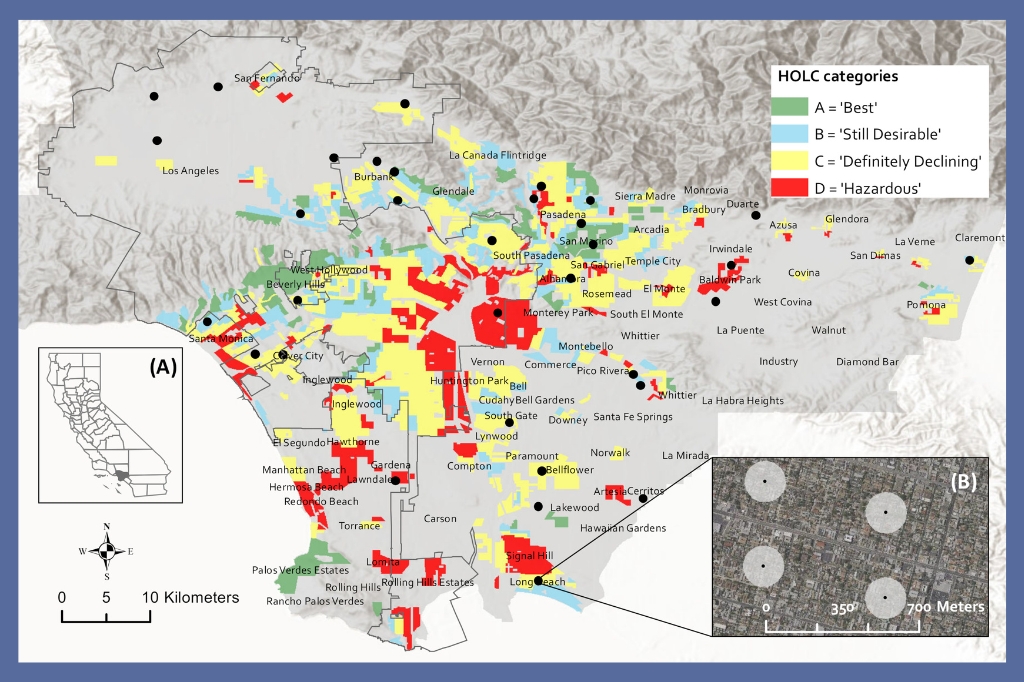
Following the Great Depression, there was a large decline in homeownership, which was a major concern for political and financial leaders (Hillier 2003). Starting in 1933, as part of the New Deal, the U.S Federal Home Loan Bank Board initiated a program named the Home Owners’ Loan Corporation (HOLC), which was intended to assist homeowners who were in default on their mortgages to avoid foreclosure as well as to identify prime areas for real estate investments (Rothstein 2017, Aaronson et al. 2021). The HOLC hand-drew ‘security risk maps’ to indicate investment risk, which was coded by four colors: green (best), blue (still desirable), yellow (definitely declining), and red (hazardous) (Mitchell and Franco 2018) (Fig. 1). In L.A., the neighborhoods that were already on the ‘up’ tended to be greenlined, such as Beverly Hills and San Marino, whereas those drawn in red (or redlined) often were locations that could have been near the oil fields or in flood-prone areas — but the defining feature was that nearly all were communities of color, or dominated by another classist designation, e.g., older or poorer.
Used with permission.
As a result, money poured into greenlined (and blue) residential areas, whereas it was difficult to impossible to get bank loans for home improvement or relocation in redlined (and yellow) zones (Mitchell and Franco 2018). There have been many papers detailing the downstream effects of the HOLC grading on urban form (Wilson 2020), segregation (Perry and Harshbarger 2019), environmental justice (Nardone et al. 2020, 2021; Locke et al. 2021; Gonzalez et al. 2023), and public health (Eisenhauer 2001). We wanted to dive further into how the practice may have had a hand in shaping the contemporary avifauna of L.A.
In 2020, the Mapping Inequality Project, an effort launched by researchers at Virginia Polytechnic Institute, Johns Hopkins University, the University of Maryland, and the University of Richmond, was published (Nelson et al. 2020). This project hand-digitized the HOLC security risk maps and thus enabled the study of the effects of the practice on urban function, human communities, public health, and in our case, birds (Schell et al. 2020). We had already been sampling birds during the winter months for years, and thus, we were able to overlay our sampling design and years of data on top of the security risk maps to ask the question, Were there associations between redlining and contemporary patterns of avifauna and their habitat? (Fig. 1). Because we also had survey locations in sections of the city that were not part of the HOLC grading, we could also test whether patterns and effects were stronger in locations graded by the HOLC compared with locations in the city that were not part of the practice (Fig. 1). We were also interested in whether the human population of L.A. was also still affected by redlining, and in turn, whether it also influenced the experience of birds for people in the city.
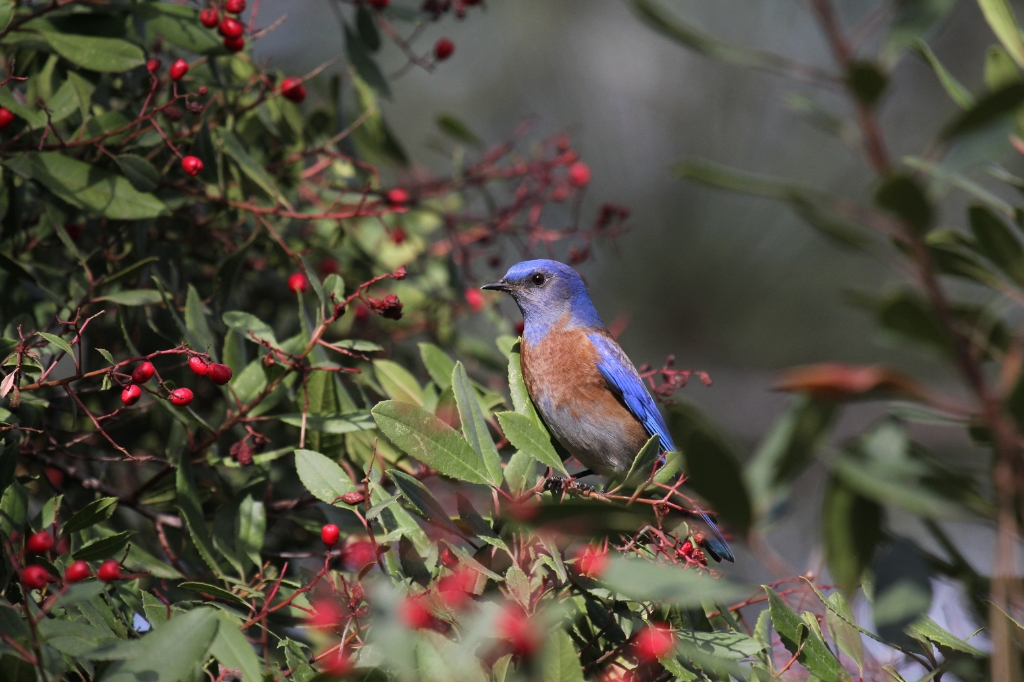
In a nutshell, redlining continues to negatively correlate to avian community patterns, habitat, and the people who may experience birds. In particular, birds that require green amenities, e.g., an overwintering Yellow-rumped Warbler (Setophaga coronata), will be more common in the wealthiest parts of L.A., whereas birds that do just fine in dense urban conditions, e.g., House Sparrow (Passer domesticus), will be most common in redlined zones. The patterns we uncovered for birds also carry over to influence humans. Greenlined zones of L.A. continue to be high-income and majority white, whereas redlined zones are low-income and majority Hispanic or Latino. Therefore, in connecting the dots, those living in greenlined versus redlined neighborhoods will likely have a different experience in the avifauna that populates their yards.
Not every redlined section of L.A. continues to suffer. For example, portions of Venice Beach and Santa Monica were redlined due to their proximity to oil wells, or their ‘slum’ appearance with ‘increasing subversive racial influences’ (Nelson et al. 2020). Of course, these locations in L.A. host some of the most expensive real estate in the country. Nevertheless, our work suggests that the majority of redlined (and yellow) areas in L.A. continue to fall below (e.g., less green amenities) that of greenlined and blue areas. Our findings were not surprising for us, or many Angelenos as you can simply see the results as you move throughout the city. But our work did link the historical element that we have been so curious about, and it does shine a glaring spotlight on how pervasive the practice of racial redlining has been in structuring the avifauna of our cities.